It’s been quite a year. When we started 2022, everything was crazy — bidding wars, immediate sales, overbidding on homes, mortgage rates under 3% — what a year it’s been.
This article will focus on what we can see for 2023. We’ve got a few more weeks of this year, we have the second week of January where we’ll see an inflection point in pricing and inventory and we’re going to see where we can look.
Tracking every home sale
Every week, Altos Research tracks every home for sale in the country. We look pricing, supply and demand changes and then we bubble up the analytics to make it available to you before you see it in the traditional channels.
Today, we’re going to look at what we can see for 2023. We’re going to start with mortgages. There’s some real news there; some real insight. The inventory trends have climbed this fall and look like they’re going do the same next year. We’re going to look at what the data says about home prices and volumes in 2023. And, we’ll help you understand how to communicate this data to your buyers and sellers.
Get ahead of the headlines
The data we’re sharing is going to be ahead of the headlines. So, many of the headlines are still going to be bearish, especially around the pricing numbers for several months and sales volumes. we’ll show you why we know that and what we can see coming in the future.
Mortgage rates are key
Let’s start with mortgage rates. I’ve been starting with mortgage rates in the last few webinars because, obviously, that’s the big story right now.
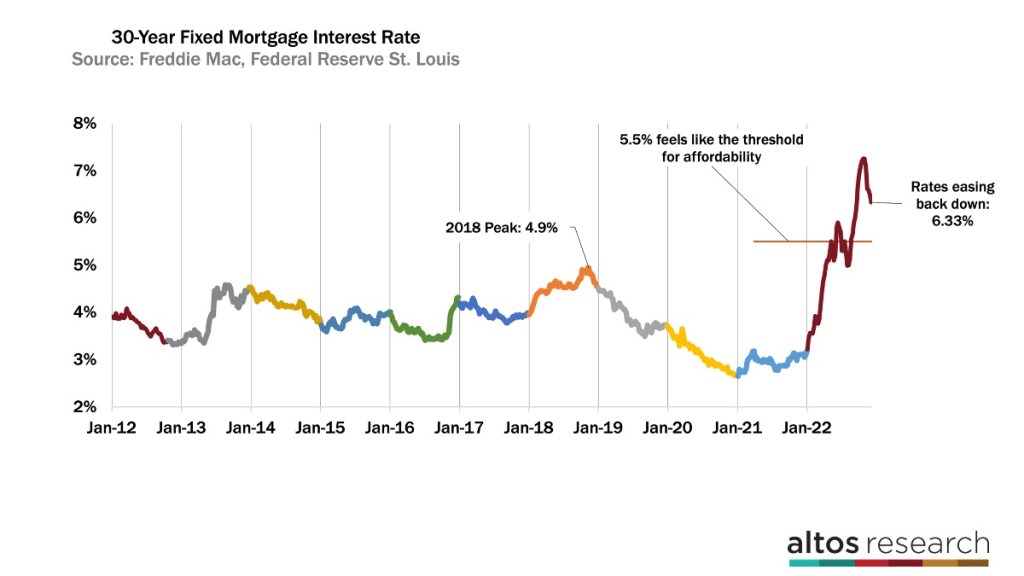
In the chart above, we show multiple years and each color is a year. The brown at the far right side of the chart, that’s 2022. We can see rates spiked dramatically this summer, they eased back down in July and August and then, starting in September to October, they spiked again with inflation numbers. What we observed is there’s a threshold at about 5.5% on the 30-year mortgage rate. Below that threshold, below 5.5%, we see people buying homes, inventory started to tick down, people were doing transactions.
Then, as rates started a little downturn, people started buying again. Very abruptly in September, the first week of September, rates spiked and, all of a sudden, we had this late summer increase in inventory and price reductions, and we could see demand stopped cold. When rates went from 5.5% to 6% and then to over 7% in that short period of time, demand stopped cold. We’ve had several weeks of mortgage rates starting to tick back down. They are down again this week with the latest inflation numbers getting closer to 6% and that’s encouraging.
This threshold is an observation that we have in the data and we could see, very quickly, the market slowed down above 6%. So, the housing market resets in January. We’re going to clean out the inventory over the holidays. We start getting the first of the fresh, new listings in the middle of January, between the second and third week of January, with new pricing and new inventory setting up for the spring selling season.
What we’ll be watching for is, if mortgage rates at that moment are trending lower and closer to 6% or under 6%, that’s going to be surprisingly bullish for the market.
Signals for a booming housing market
Now, there are only signals that we’re going to have a booming housing market in the next year but, if rates are drifting closer to 6% and under 6%, that’s going to be significant for buyers. There’s an affordability threshold of about 5.5%.
If buyers have more selection now, and they have better financing than they did last summer, you’ll start to see how the people are going to take action and purchase homes. If, on the other hand, rates turn around and start spiking back up, that’s going to add negative pressure to buyers, and they’ll stop. That could be bearish, especially for pricing and transaction volumes in the next year. So, keep your eyes on that. As of right now, fingers crossed, rates are easing back down closer to 6%.
Expect Inventory to turn the corner
Here’s where we can see the inventory numbers. So, we have eight years of data on total single-family homes for sale in the U.S. in the graphic below. This week, inventory is down 2.5% to 535,000 single family homes. So, it’s post-Thanksgiving, inventory always falls, and will likely fall another 1% to 2% this week, next week and then during Christmas and New Years.
So, we’ll have four more weeks of declining inventory. It’s very common in many years to have the second to third week of January be the lowest point of inventory. Inventory starts climbing back up, and I expect it to be that case now because there’s not enough volume.
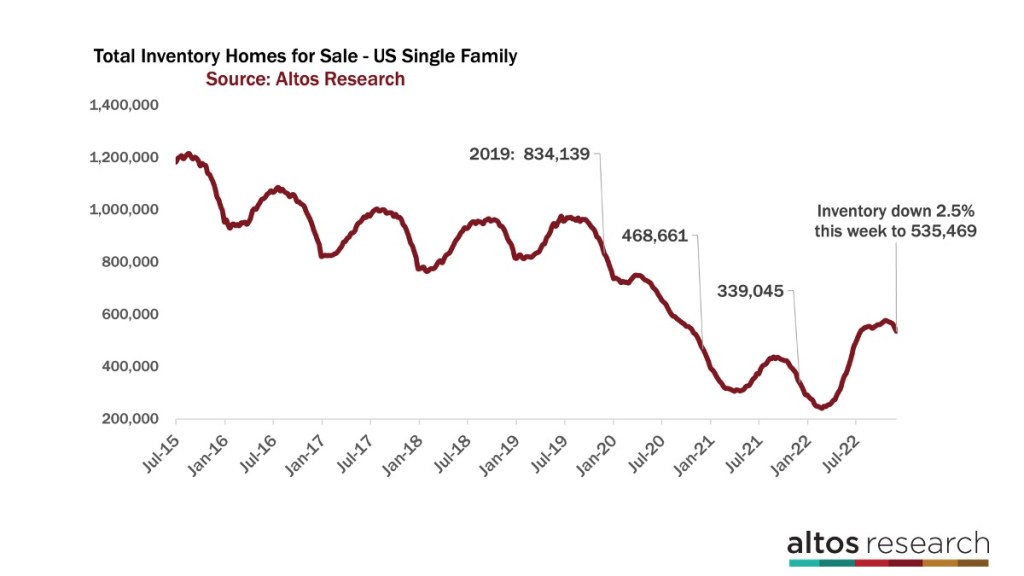
So, expect inventory to turn the corner. We’ve really only got about four more weeks of declining inventory before it starts climbing for the year. Inventory is still 36% lower than we had in 2019. So, for buyers, we have more selection than we’ve had in several years.
It’s a funny characteristic that happens because, if I’m buying, I still don’t have a lot of selection. I have better pricing selection because things have been moving more slowly. I don’t have to go through a bidding war. If the price isn’t right on that property, I don’t have to take action right now. I can wait for the one that is right. There’s a lot more opportunity for buyers in this market and — especially if rates tick under 6% — I think you’re going to see some buyers start to loosen up in that case.
So, what does that look like? So, this is how the year has played out. We can see there’s a little bump here at the far right end of the chart where inventory started to tick down and then it ticked up. That’s that September 1 rate spike, and we can see mortgage rates spiked and inventory climbed until the end of October, which was very unusual.
Then, at the end of October, rates started ticking back down and now we’re in the sixes and so now we’re on our little seasonal down curve. So, we’re going to end significantly higher than we did when we started the year, significantly higher than we were at the beginning of 2021, but still fewer than when we started in 2020 pre pandemic. And so, it’ll be about a third, 30% fewer than that.
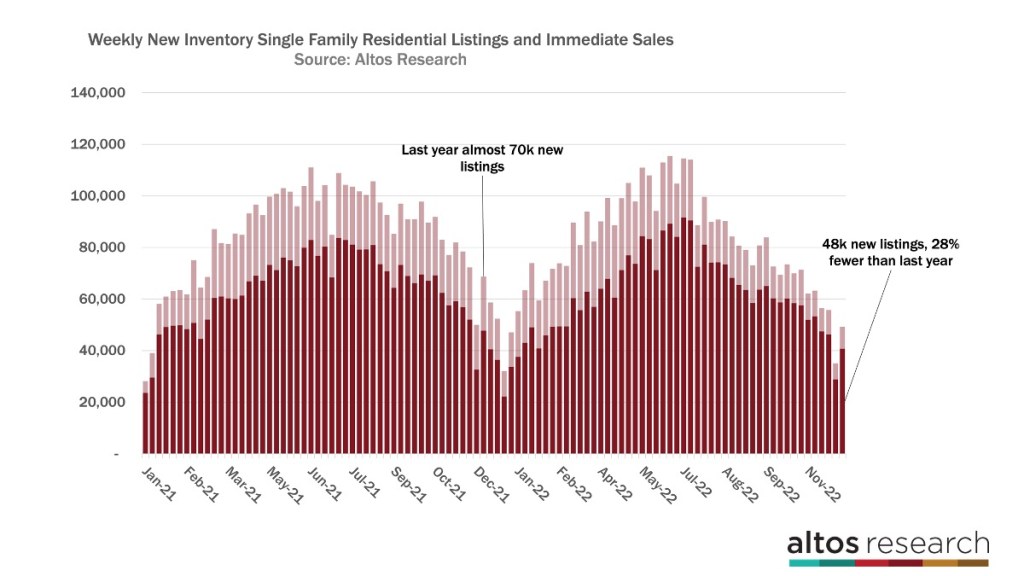
Here’s what it looks like on the new listing side. So, one of the reasons that inventory isn’t climbing more dramatically is because, even though demand has slowed way down, the new listings volume is way down.
What we’re looking at here is a chart (above) where each bar is a week, and it’s the total new listings that come to market. The light portion of the bar are those that went into contract. They go into contract essentially immediately after listing. During the pandemic, we called this immediate sales.
Anybody who wanted to sell in 2022, that supply was pulled forward into the first half of the year. They didn’t need to sell, so you could see this dramatic drop off in the new listing volume. We can see the light portion is getting smaller each week, so that’s the immediate sales. Key here is that new listings volume is 28% fewer than last year this time and that’s going to keep a lid on inventory.
This may change as economy slows. If we have a recession, especially if we have a big recession, people are worried about their jobs or they’re losing their jobs, that contributes to new inventory. And so, there are fewer things like investment properties being bought that contributes to more inventory piling up.
Those are factors that we’ll see but, in general, homeowners have locked in their mortgages at very low rates low. They have lots of equity and, right now, everybody has jobs so there’s really no urgency to sell, so that’s keeping a lid on our inventory.
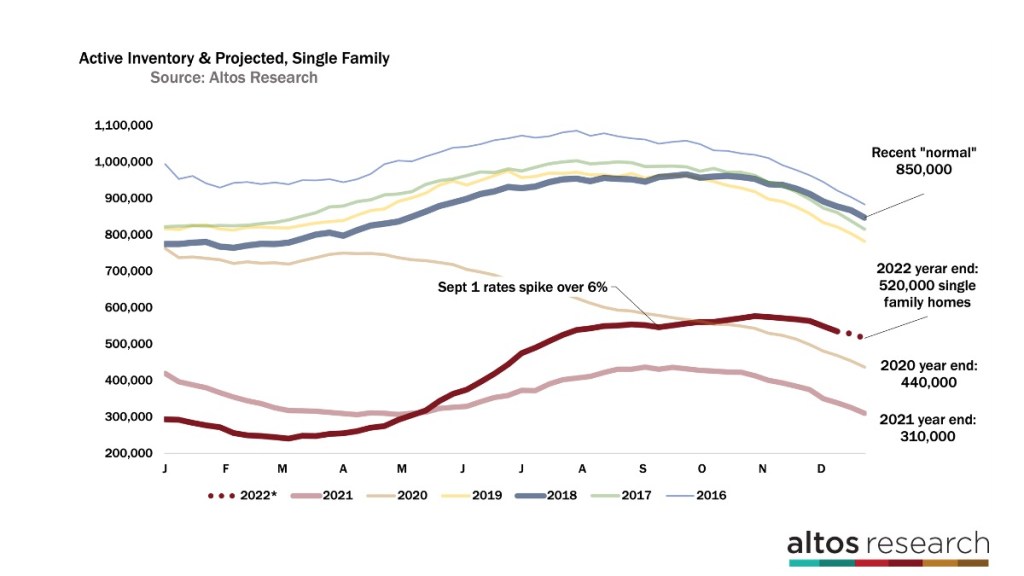
Inventory projections
And this is our projection. We’re going to end the year with about 520,000 single family homes on the market, maybe less than that, closer to 510,000. But this is about what we’ve been projecting since September.
If rates reverse in the first quarter, look for a stronger spike in inventory at that time. If rates fall back under 6%, you can imagine this curve then tops off much less steep and keeps us in maybe a 600,000 range. But that means for buyers, it’s more inventory and more selection. For sellers, it means opportunity because the inventory is restricted from where it normally would be. But it also means, as a seller, you can’t overprice because, when rates are at 3% or lower, another $100,000 bid doesn’t translate into much payment difference. But at 6%, every dollar starts to matter and so buyers are sensitive to that.
So, really, it’s a pricing strategy for sellers when we’re looking at what’s happening in the coming year. So, we adjust this forecast each week when we get new data and so we’ll keep sharing this as we go through the year. And, if we’re lucky and we roll into January and February and rates have drifted under 6%, that’ll probably adjust this down, will peak with fewer properties, we’ll have a more normal curve in terms of total inventory levels for the year. So, we’ll keep our eye on that as we go through the year. So, that’s the inventory side, that’s the supply side.