The available inventory of homes for sale dropped big this week. Thus far in 2023, demand for homes has exceeded the number of sellers who are willing to sell. According to the data, sufficient numbers of homebuyers are able to afford homes at these prices and at these mortgage rates. Buyers know that if they buy now and rates decline in the future, then they can refinance in the future. And, if rates go up in the future, then a buyer can see that they’re already in the best position.
Inventory
Inventory of homes for sale continues to fall. Falling inventory in February is actually a pretty unusual phenomenon. Prior to the COVID-19 pandemic, it was normal for inventory to rise in February as the spring home sellers began listing their homes and buyers weren’t yet out in force. But in 2020 through 2022, buyers came out quickly after the new year and inventory didn’t hit bottom until much later in the spring.
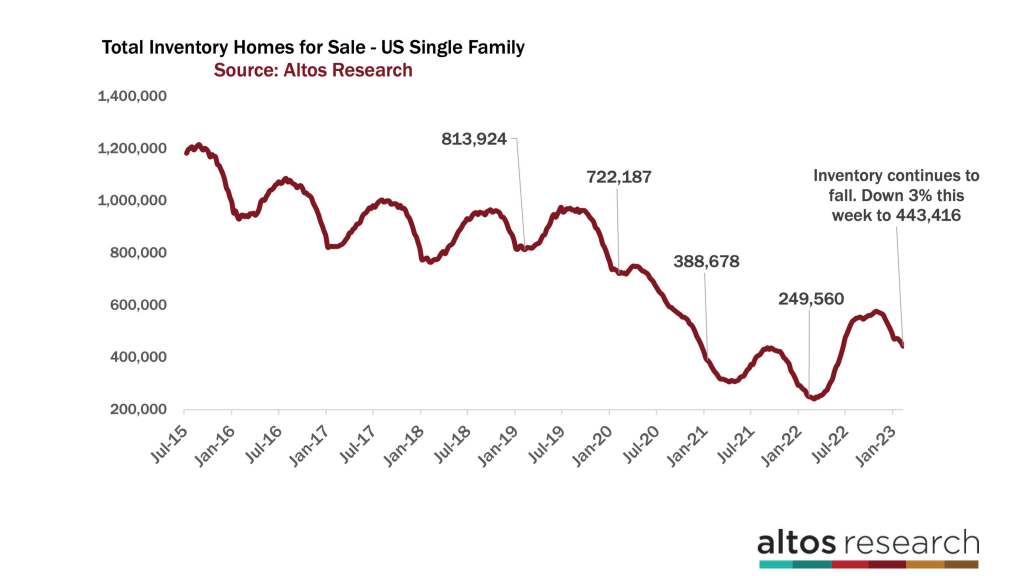
After the fall of 2022, our models assumed that inventory would bottom in January 2023 and be climbing by 1-2% weekly by February. Instead, inventory fell by 3% this week. This is a big step down. There were far more buyers than sellers this week. There are now only 443,000 single-family homes on the market across the whole country.
On the right side of the chart below you can see how steep the decline over the past few weeks. I’ve highlighted 2019 on this chart. It indicates there were 814,000 homes on the market, and the inventory had rounded the corner and begun to climb for the year which was how it used to behave. Now, there are 46% fewer homes on the market compared to 2019. We started the year with expectations of returning to those previous normal levels of inventory and yet the data continues to defy our expectations.
It would be a mistake to think of this ‘spring market surprise’ to be driven only by demand. The demand is present, but this is really a story of supply. Much of the U.S. is still hitting historic lows in terms of homes on the market. Very few new listings are becoming available each week.
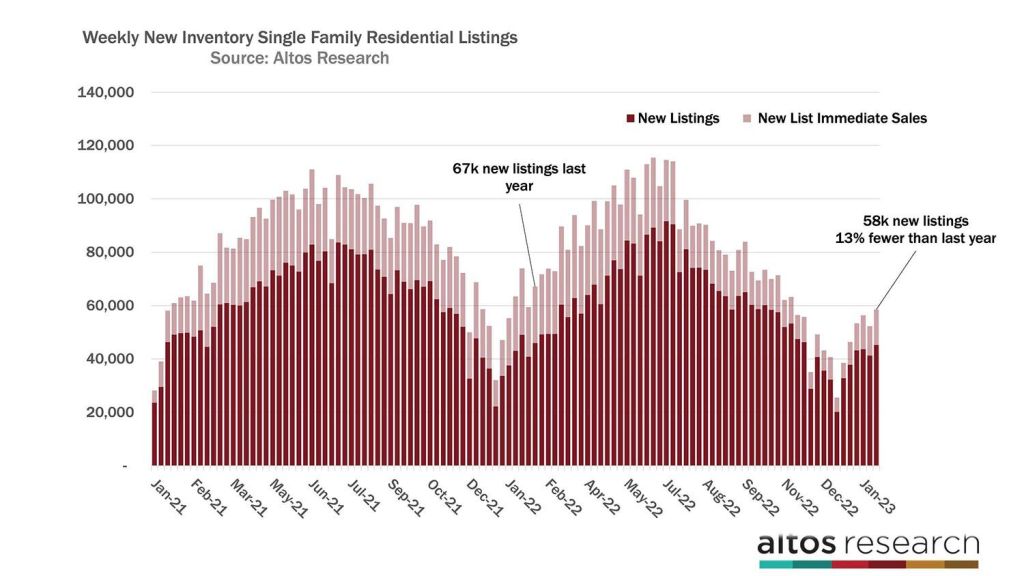
This week 58,000 single-family homes came on the market. That’s 13% fewer than the number from this week in 2022. If you were expecting inventory to climb because of a scary economy or investors panicking, you’re being surprised every week. Americans are holding onto their 3% mortgages. They’re not eager to sell their homes.
Each bar stands for the total count of new listings in a week. The light portions of the bar are those homes that went into contract immediately after listing. In 2022, rates were just starting to tick higher, but they were still in the 3% range. And so, we had bidding wars and off-the-chart levels of demand. You can see the light portion of the bar last year was much bigger. We had 13,000 immediate sales this week compared to 22,000 immediate sales at this time in 2022. The total new supply is less, the urgent demand is less too, but overall demand is still sufficient to keep the total inventory shrinking each week.
Price
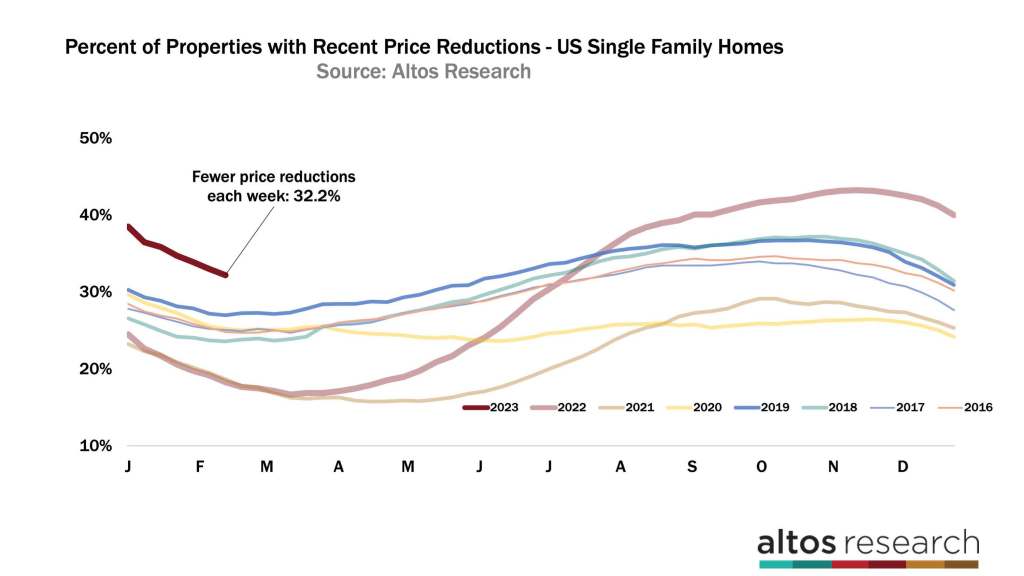
We can see this supply and demand equation play out in the price reduction data too. This week, price reductions fell to 32.2% of the market. 32% of the homes on the market have taken a price cut recently. This is totally normal.
In the chart below, every line represents a year. This year’s dark red line is dropping rapidly. If it continues at this pace it could be under 30% in a few weeks. That would illustrate a remarkable market turnaround from last fall. See how quickly the light red line climbed in 2022? Again, today’s demand is not as crazy as last year when only 18% of the market took a price cut. Now it’s 32%, but it is tightening rapidly.
When we measure the pending sales in the chart below, we can see a steady climb in home sales is coming. In 2022, the year finished with very few transactions. But each week now the pending sales count is climbing rapidly. There are now 291,000 single-family homes in contract across the U.S. That’s 23% fewer than this time in 2022. Last year at this time was one of the hottest markets ever. In fact, last year at this time we had more homes in contract than we did available on the market to buy!
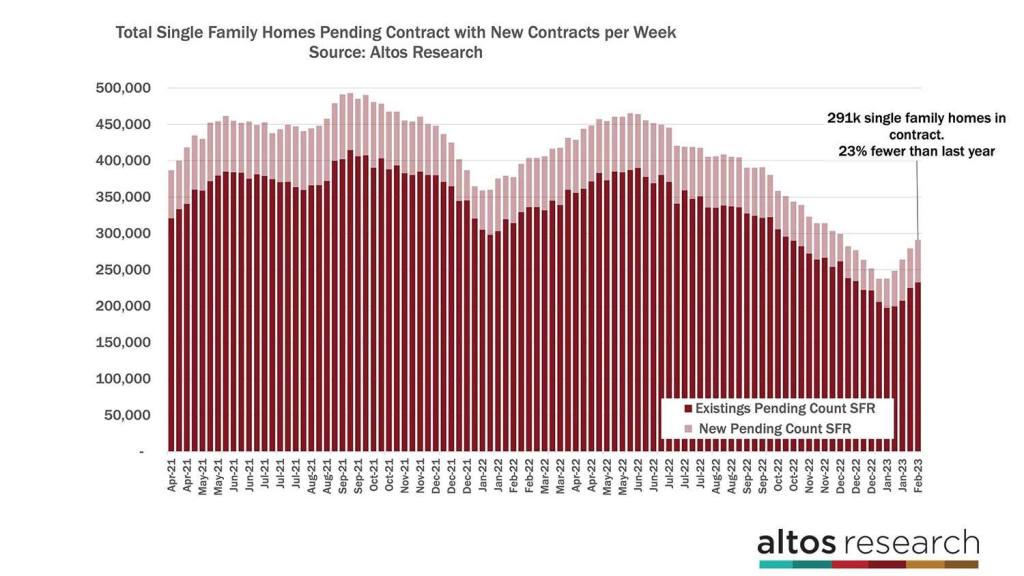
There were 13,000 new pending sales this week, which is only 9% fewer than in 2022 at this time. According to this trend, the sales gap will continue to narrow. There are still fewer sales now, but things are looking much better than the catastrophic fall market.
That all comes together in the price trends data. Home prices are slowly rising from the holiday lows as you’d expect this time of year. The median single-family home price in the US right now is $418,200. That’s up a fraction from last week.
The important thing to note in the pricing data is that none of the leading indicators are particularly strong. In fact, the price of the new listings — all the homes newly listed this week is exactly the same as it was in 2022. Last year, demand was off the charts — you can see the light-colored line in the chart below was jumping each week. This year, the light-colored line is moving sideways.
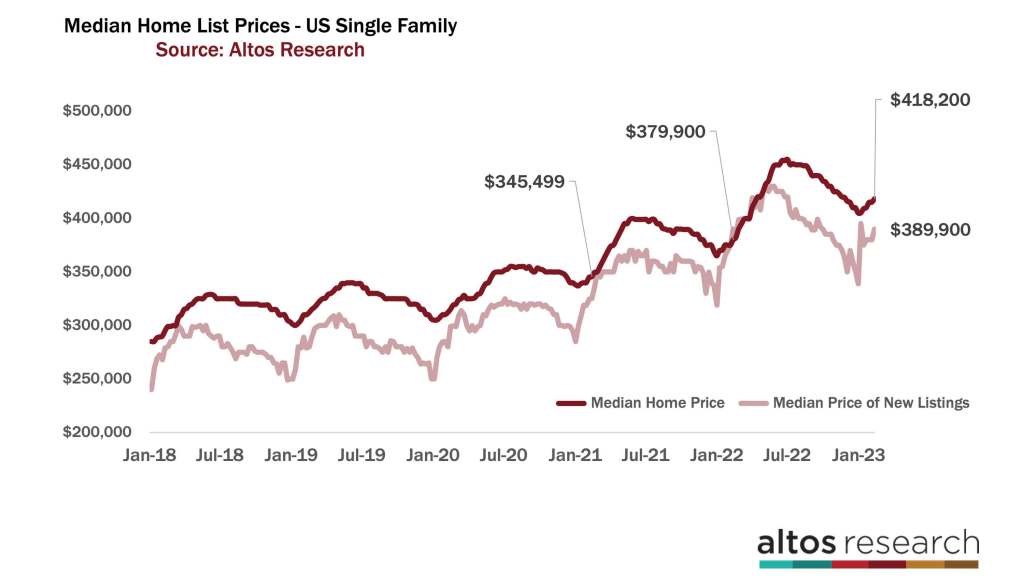
The price of the newly listed cohort leads the full active market, which leads the pending sales. So as we see supply contracting across the U.S., we also see sufficient demand despite higher mortgage rates. Because of the affordability of these rates, home prices aren’t being driven any higher. At least not yet. This week mortgage rates jumped, so next week’s data should prove whether or not Americans are sensitive to those changes in costs.

