Decline in Year-Over-Year Showing Activity Shows Anomalies as Buyer Demand Remains Strong in Most of U.S.
Hurricane Florence doesn’t slow activity in the South; rest of country experiences a year-over-year decrease
Key Points:
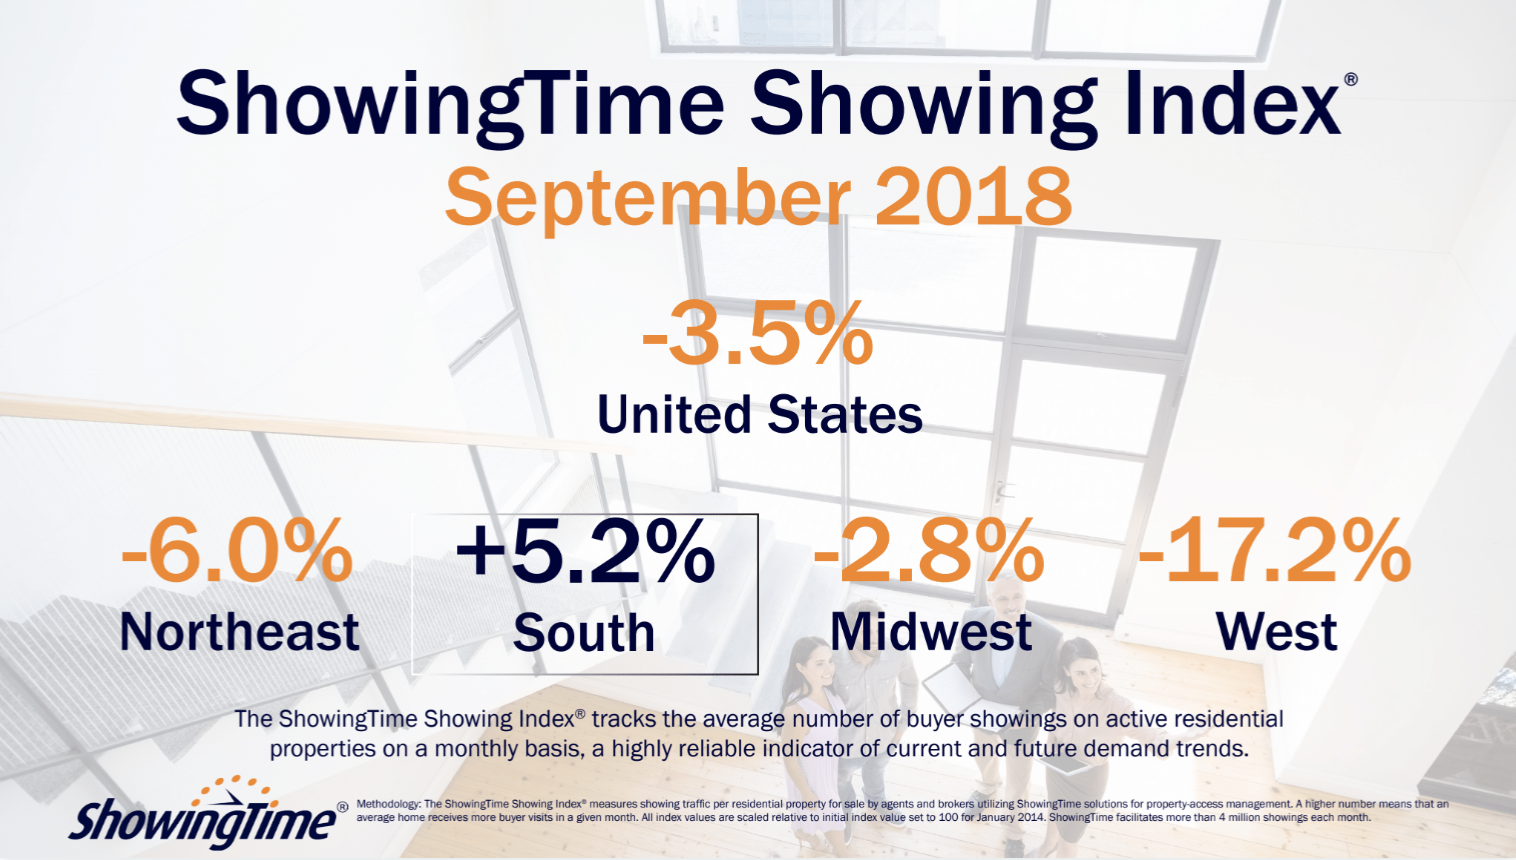
- The U.S. ShowingTime Showing Index® for September 2018 experienced a -3.5 percent change compared to September 2017 when showing traffic was near an all-time high
- South Region (+5.2 percent) exhibits 12th consecutive monthly year-over-year increase; showings decline year over year in West (-17.2), Northeast (-6.0) and Midwest (-2.8)
- ShowingTime combines showing data with findings from its MarketStats division to provide a set of benchmarks that track demand for active listings throughout the country
The ShowingTime Showing Index® revealed today that homebuyer demand remains high throughout much of the country despite showing activity leveling off from last year’s record numbers.
The September 2018 U.S. Index exhibited a 3.5 percent year-over-year decrease in showing traffic, the second consecutive month the national index has decreased from last year’s historic heights.
September showing activity also decreased year-over-year in the Northeast (-6.0) and Midwest (-2.8 percent) regions, marking the fifth straight month of declining showing traffic in the Northeast and second straight in the Midwest.
The West Region, which has experienced high prices and tight inventory for much of the year, decreased by 17.2 percent year-over-year. September is the eighth consecutive month the region has exhibited year-over-year declines.
“Most regions posted year-over-year decreases last month, which is a continuation of the trend we’ve been tracking for the West Region,” ShowingTime Chief Analytics Officer Daniil Cherkasskiy said. “For the Midwest Region, though it has posted a slight year-over-year decline, pending next month’s adjustment, it’s more the result of the Showing Index hovering close to all-time highs over the last 18 months.”
The South Region continued to experience an increase in showing activity despite Hurricane Florence hitting land on Sept. 14, exhibiting a 5.4 percent year-over-year increase. That increase is due to showing traffic decreasing following Hurricane Irma in September 2017.
The ShowingTime Showing Index, the first of its kind in the residential real estate industry, is compiled using data from property showings scheduled across the country on listings using ShowingTime products and services, which facilitate more than 4 million showings each month.
Released on or around the 20th each month, the Showing Index tracks the average number of appointments received on an active listing during the month. Local MLS indices are also available for select markets and are distributed to MLS and association leadership.
To view the full report, visit showingtime.com/showingtime-showing-index/.
About ShowingTime
ShowingTime is the leading showing management and market stats technology provider to the residential real estate industry, with more than 1.2 million active listings subscribed to its services. Its MarketStats division provides interactive tools and market reports for MLSs, associations, brokers, agents, and other real estate companies, along with recruiting software that enables brokers to identify top agents. Its showing products take the inefficiencies out of the appointment scheduling process for real estate agents, buyers and sellers. ShowingTime products are used in more than 250 MLSs representing over 950,000 real estate professionals across the U.S. and Canada.