- Nevada, Utah and Washington Start the Year With Largest Price Gains
- In January, 48 Percent of the Top 50 Markets Were Considered Overvalued
- Home Prices Projected to Increase by 4.8 Percent by January 2019
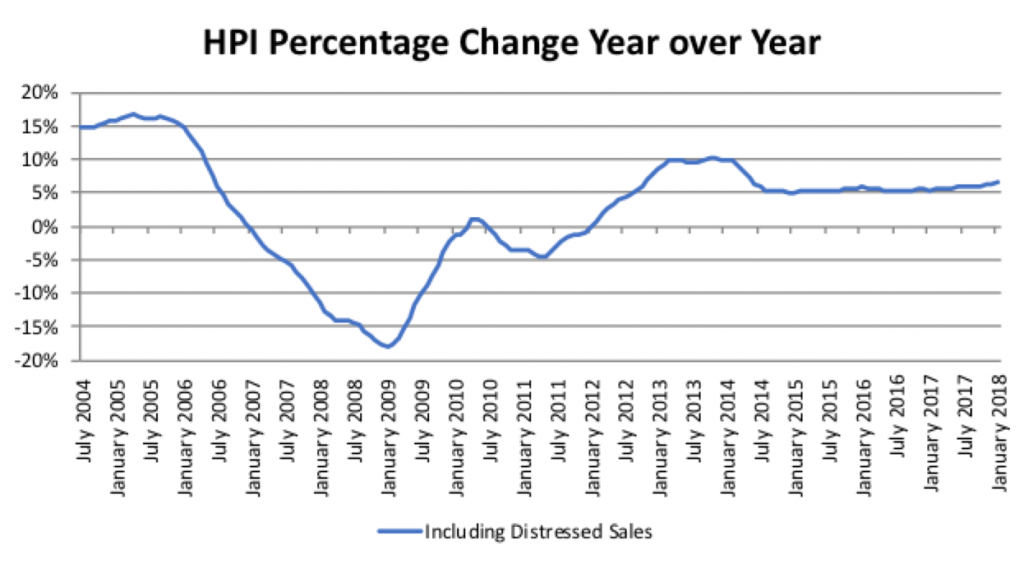
CoreLogic® (NYSE: CLGX), a leading global property information, analytics and data-enabled solutions provider, today released its CoreLogic Home Price Index (HPI™) and HPI Forecast™ for January 2018, which shows home prices rose both year over year and month over month. Home prices nationally increased year over year by 6.6 percent from January 2017 to January 2018, and on a month-over-month basis home prices increased by 0.5 percent in January 2018 compared with December 2017,* according to the CoreLogic HPI.
Looking ahead, the CoreLogic HPI Forecast indicates that the national home-price index is projected to increase by 4.8 percent on a year-over-year basis from January 2018 to January 2019, with a 12-month increase of more than 7 percent projected for California, Florida, Nevada and Oregon. The CoreLogic HPI Forecast is a projection of home prices that is calculated using the CoreLogic HPI and other economic variables. Values are derived from state-level forecasts by weighting indices according to the number of owner-occupied households for each state.
“Entry-level homes have been in particularly short supply, leading to more rapid home-price growth compared with more expensive homes,” said Dr. Frank Nothaft, chief economist for CoreLogic. “Homes with a purchase price less than 75 percent of the local area median had price growth of 9.0 percent during the year ending January 2018. Homes that sold for more than 125 percent of median appreciated 5.3 percent over the same 12-month period. Thus, first-time buyers are facing acute affordability challenges in some high-cost areas.”
According to CoreLogic Market Condition Indicators (MCI) data, an analysis of housing values in the country’s 100 largest metropolitan areas based on housing stock, 34 percent of metropolitan areas have an overvalued housing market as of January 2018. The MCI analysis categorizes home prices in individual markets as undervalued, at value or overvalued, by comparing home prices to their long-run, sustainable levels, which are supported by local market fundamentals such as disposable income. Also, as of January 2018, 27 percent of the top 100 metropolitan areas were undervalued and 39 percent were at value. When looking at only the top 50 markets based on housing stock, 48 percent were overvalued, 14 percent were undervalued and 38 percent were at value. The MCI analysis defines an overvalued housing market as one in which home prices are at least 10 percent higher than the long-term, sustainable level, while an undervalued housing market is one in which home prices are at least 10 percent below the sustainable level.
“A rise in mortgage rates coupled with home-price growth further erodes affordability,” said Frank Martell, president and CEO of CoreLogic. “CoreLogic has identified nearly one-half of the 50 largest metropolitan areas as overvalued. Millennials who are looking to become first-time homeowners find it particularly challenging to find an affordable home in these areas. Our projections continue to show tightness in the entry-level market for the foreseeable future, which could further prevent millennials from purchasing homes in 2018 and 2019, even as much of that generation reaches its prime home-buying years.”
*December 2017 data was revised. Revisions with public records data are standard, and to ensure accuracy, CoreLogic incorporates the newly released public data to provide updated results.
Home Price Change and Market Conditions for Select Metropolitan Areas
| Select Metropolitan Areas |
January 2018 12-Month HPI Change Year Over Year Single-Family |
Market Condition as of January 2018 |
| Las Vegas-Henderson-Paradise NV | 11.7% | Overvalued |
| San Francisco-Redwood City-South San Francisco CA | 10.2% | At value |
| Denver-Aurora-Lakewood CO | 8.4% | Overvalued |
| Los Angeles-Long Beach-Glendale CA | 7.8% | Overvalued |
| Boston MA | 5.7% | At value |
| New York-Jersey City-White Plains NY-NJ | 4.9% | Overvalued |
| Chicago-Naperville-Arlington Heights IL | 3.8% | At value |
| Houston-The Woodlands-Sugar Land TX | 3.9% | Overvalued |
| Miami-Miami Beach-Kendall FL | 3.6% | Overvalued |
| Washington-Arlington-Alexandria DC-VA-MD-WV | 3.0% | Overvalued |
| Source: CoreLogic January 2018 |
National Home Price Change
Home Price Change by State
| State | January 2018
12-Month HPI Change Year Over Year Single-Family |
| National | 6.6% |
| Alabama | 5.1% |
| Alaska | 0.7% |
| Arizona | 6.4% |
| Arkansas | 4.0% |
| California | 8.3% |
| Colorado | 8.3% |
| Connecticut | 1.7% |
| Delaware | 0.7% |
| District of Columbia | 1.5% |
| Florida | 5.6% |
| Georgia | 6.5% |
| Hawaii | 4.1% |
| Idaho | 10.3% |
| Illinois | 3.7% |
| Indiana | 5.8% |
| Iowa | 3.7% |
| Kansas | 5.1% |
| Kentucky | 5.6% |
| Louisiana | 6.0% |
| Maine | 8.1% |
| Maryland | 3.4% |
| Massachusetts | 6.1% |
| Michigan | 7.3% |
| Minnesota | 6.0% |
| Mississippi | 3.3% |
| Missouri | 4.8% |
| Montana | 8.4% |
| Nebraska | 5.4% |
| Nevada | 11.3% |
| New Hampshire | 5.0% |
| New Jersey | 2.2% |
| New Mexico | 4.3% |
| New York | 5.7% |
| North Carolina | 5.5% |
| North Dakota | 5.5% |
| Ohio | 6.2% |
| Oklahoma | 2.0% |
| Oregon | 6.8% |
| Pennsylvania | 3.5% |
| Rhode Island | 8.4% |
| South Carolina | 5.5% |
| South Dakota | 9.2% |
| Tennessee | 6.5% |
| Texas | 5.6% |
| Utah | 10.8% |
| Vermont | 4.1% |
| Virginia | 2.6% |
| Washington | 12.1% |
| West Virginia | 2.3% |
| Wisconsin | 5.8% |
| Wyoming | 1.7% |
| Source: CoreLogic January 2018 | |
Methodology
The CoreLogic HPI™ is built on industry-leading public record, servicing and securities real-estate databases and incorporates more than 40 years of repeat-sales transactions for analyzing home price trends. Generally released on the first Tuesday of each month with an average five-week lag, the CoreLogic HPI is designed to provide an early indication of home price trends by market segment and for the “Single-Family Combined” tier representing the most comprehensive set of properties, including all sales for single-family attached and single-family detached properties. The indexes are fully revised with each release and employ techniques to signal turning points sooner. The CoreLogic HPI provides measures for multiple market segments, referred to as tiers, based on property type, price, time between sales, loan type (conforming vs. non-conforming) and distressed sales. Broad national coverage is available from the national level down to ZIP Code, including non-disclosure states.