Available inventory of homes for sale is on the rise in late September, which is very unusual for this time of year. In fact, inventory is growing faster than this time a year ago.
This is a demand-driven slowdown, because new listings supply is still running 9% to 10% fewer homes for sale each week than this time last year. We’re seeing fewer new sellers each week, but inventory is building as homebuyers wait to see if mortgage rates will come down to make purchases more affordable.
What’s happening with inventory?
Fewer new sellers also means that inventory can’t grow too much; the real trouble develops when demand drops and supply surges. There’s no supply surge, but there is a notable demand drop. Consumers are very sensitive to changes in mortgage rates, and rates are still rising.
We can see these slowing changes build up each week. It’s a pretty sharp change from what was a surprisingly strong first half of the year. There are now 528,000 single-family homes on the market. That’s an increase of 1.8% from last week.
Normally by this point in September, available inventory is declining slightly each week. It’s late in the summer, so normally new listing volume drops as the last few sales of the peak summer months are concluding.
The fact that inventory grew by nearly 2% this week and last week is telling of how homebuyers are reacting to the highest mortgage rates in over two decades.
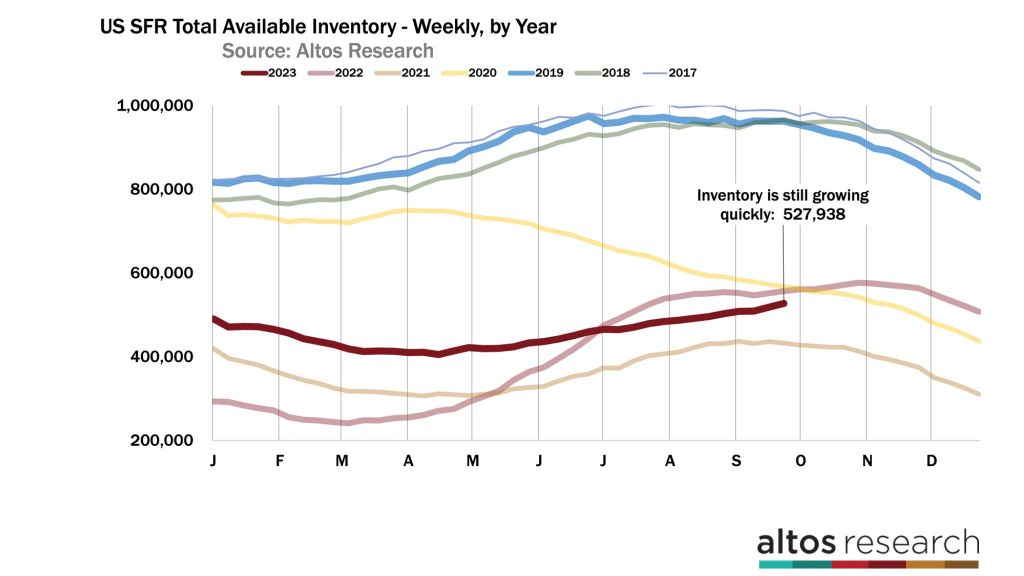
In this chart of each year’s inventory curves, you can see that the number of homes on the market is climbing faster now than this time last year. This year is the dark red curve, and last year the light red. Mortgage rates continue to climb, so there is no immediate relief for homebuyers on the horizon either.
At this point, it looks like we may see inventory grow to the end of October like we did last year. Look at the divergence in the curves from this year and the tan line from two years ago when we were still in the middle of the pandemic housing boom and record-low mortgage rates.
Pending-home sales continue to lag
New pending sales each week continue to run 10% to 15% below last year’s pace. If you follow the National Association of Realtors when they publish their existing-home sales report each month, you know that the latest report for August showed a sales pace of only 4 million seasonally adjusted annual home sales.
We can already see in the NAR data that there are no signs of improvement for the sales count through September and October. The home sales that are in contract now will close mostly in October. It’s not hard to imagine that next month’s seasonally adjusted home sales data from NAR will come in under 4 million.
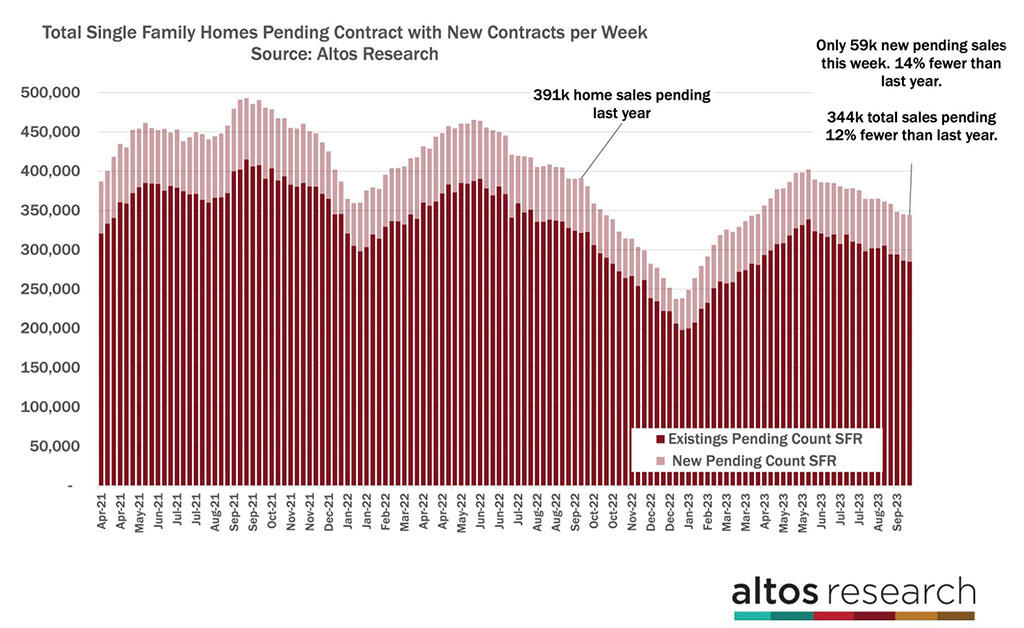
In this chart, each bar is the total number of home sales pending on any given week. The shorter the bar, the fewer sales that are in progress. The light portion of the bar is the count of new pendings each week.
There are now 344,000 single-family homes in contract to close in the next couple months. That’s 14% fewer than last year and almost 30% fewer than in September of 2021.
Home sales are limited by the decreased demand, of course, and they’re also limited by the very low supply of new listings. You can’t buy what’s not for sale.
We’ve been talking all year about the market being supply constrained. Right now, sales are limited by declining demand from still-climbing mortgage rates.
Price reductions climb again
We can see the impact of weaker demand starting to creep into the pricing indicators. In the chart below, we look at the leading indicator of this trend: price reductions. This is the percent of homes on the market that have taken a price cut from their original list price.
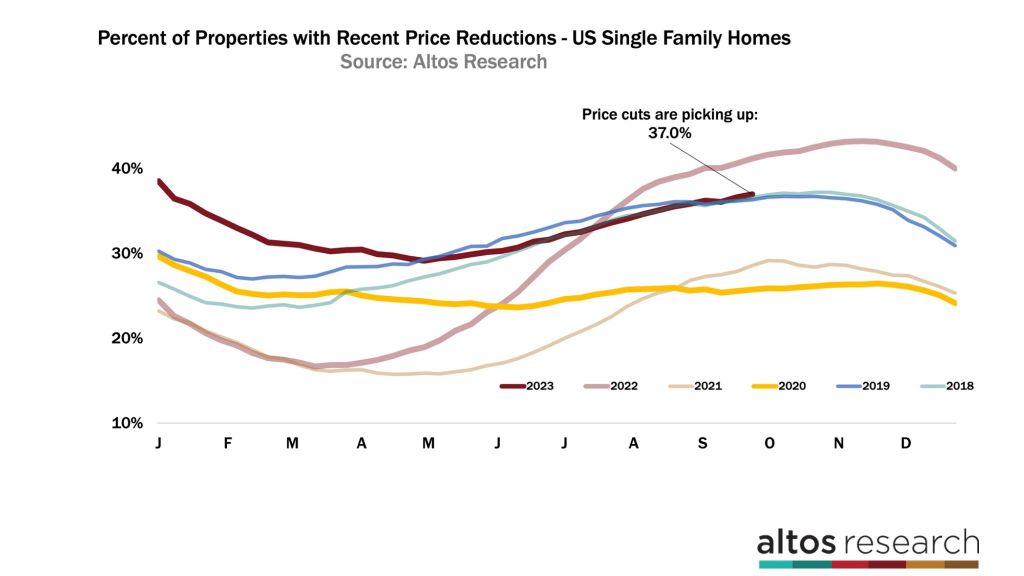
For a while earlier this year, demand was exceeding supply in residential real estate, and you could measure that demand with the price-reductions curve improving each week. As mortgage rates lurched over 7% to their new highs, suddenly there are fewer offers.
And home-price reductions are climbing again, with 37% of the market taking a price cut. That’s more than any recent year except last year at this time. Price reductions are accelerating now, which bodes negatively for future sales prices.
A normal, balanced market will have 30% to 35% of the homes for sale that have reduced their asking price in recent months. As this dark red line approaches 40%, that’s a clear indicator that buyers are making fewer offers. Remember, the slope of this line captures how many properties are taking new price cuts each week. And this slope is increasing now.
These are transactions that will happen in the future, so it implies sales price weakness in the fourth quarter, which you’ll hear about in the headlines after the new year. But you can see it in the data now.
Median home prices show weaker year-over-year gains
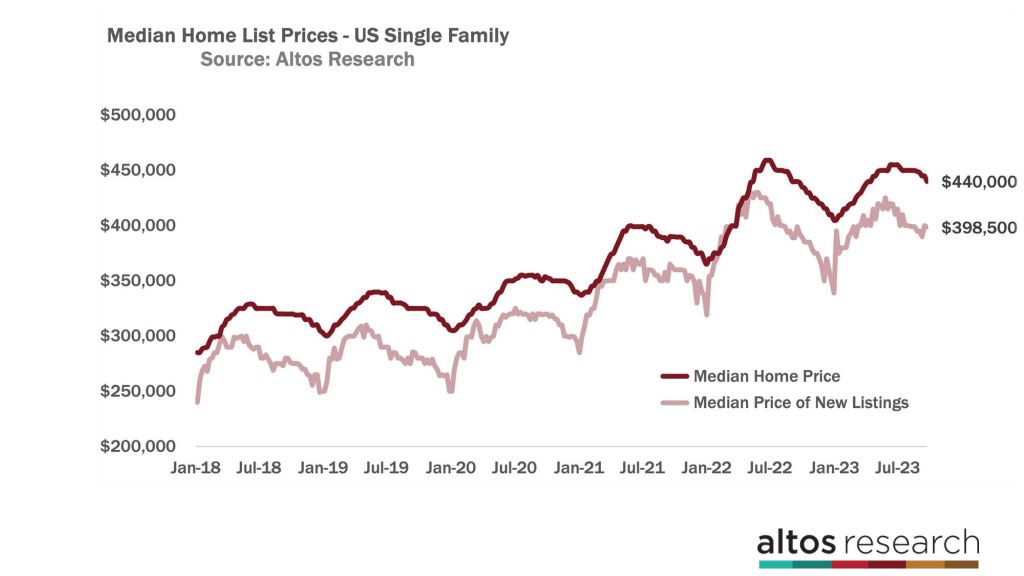
The median sales price of single-family homes in the U.S. right now is $440,000. That’s down 1% from last week and it’s just a tiny fraction higher than this time last year.
We can see the pressure on home prices in recent weeks. Home prices step downward in September for the seasonal change every year, and you can detect strength or weakness relative to changes in other years.
What we see now is that year-over-year price gains are just barely positive. And the comparison is getting weaker, not stronger, as our current mortgage markets deteriorate. There are fewer offers, and those that do happen are doing so at slight discounts each week.
Last year at this time, there were big price discounts being applied. So, our October comparisons may get slightly easier, but I sure haven’t seen any signals of price strength now.
Looking ahead to the end of 2023
So the question is will Q4 this year be a little better than Q4 2022? The median price of the new listings is fractionally higher than last year at $398,500. It will be fascinating to watch the light colored line here over the next couple weeks.
The new listings are where you see price weakness first. And last year, they were already headed lower.
The price of the new contracts this week came in at $370,000. These are the pending-home sales that went into contract in the last week. Prices of the homes going into contract are lower than last year by a fraction.
The next few weeks will be interesting to track this stat, too. Last year in mid-September is when mortgage rates jumped from 6% to 6.5% to 7.5%. By early October, any offers that were made for purchases came in at notably lower price points.
By September 2022, new pending-home sales prices fell by 3% per week. Will that happen again? Mortgage rates are even higher now than they were last year.
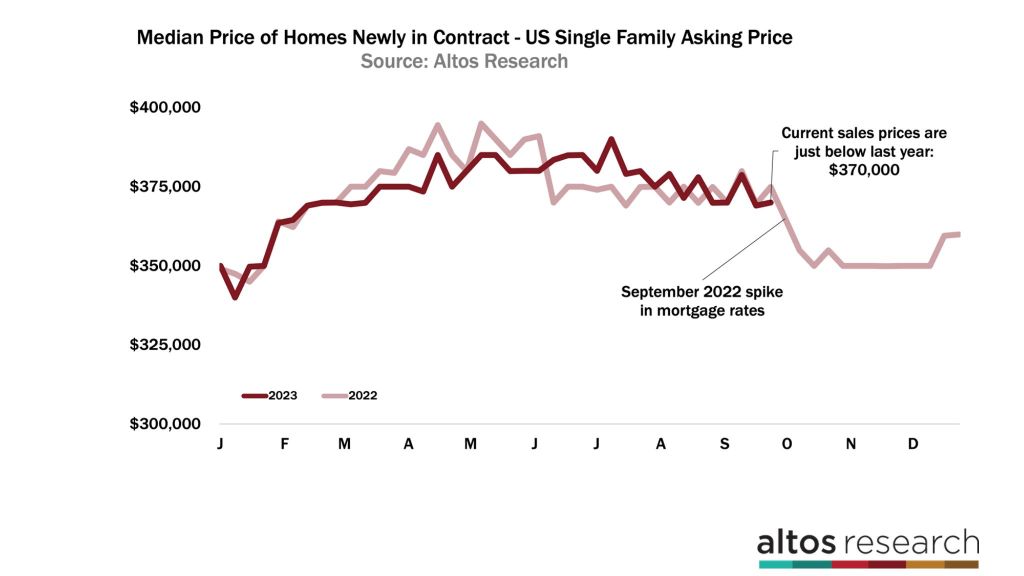
In this chart, you’ll notice the light-colored line started a big decline during this week in 2022. That’s when buyers reacted to newly increased mortgage rates. So, we’re watching to see where the new contracts come in over the next few weeks.
The macro trends impacting mortgage interest rates and the Fed have not given us any reprieve yet. The signals are that mortgage rates are still headed higher.
Consumer expectations for future mortgage rates have moved higher, too, so potential homebuyers are less optimistic than they were at the start of the year. And that’s what we’re seeing in the data each week now.
However, it’s important to point out that while buyer demand has backed off this fall, there is still no sign of any surge in new supply coming to the market. It can be very easy to focus on the negative momentum.
People on the fence should also know that while their competition is lessening, there’s no sign of an inventory flood. That may be an important factor in their home-buying decisions.
Mike Simonsen is president and founder of Altos Research.