I read a Wall Street Journal editorial piece that cited a stat to say home prices are 13% below last year. That’s blatantly wrong. Home prices remain just fractionally above where they were a year ago. The point of the editorial seemed to be to scaremonger over government programs to help home buyers and student loan borrowers. If home prices are tanking, that means more borrowers are under water. So, the author tried to use new construction prices from back in April to describe the whole U.S. housing market now.
The fact is that while people who bought homes in May of last year in say, Austin, Texas, are probably underwater a bit, in general home prices across the country are roughly unchanged from last year at this time. That’s frankly surprising given how cold the housing market froze last fall. We have significantly fewer home sales happening. Supply of homes for sale is very low, and most of the year we’ve had more buyers than sellers. There are no signs of any surge in listings, and as a result we’ve seen a floor on home prices.
This week continues that trend. New contracts dipped as affordability is out of reach for so many. Inventory is very low and just inching up now week over week late in the summer. There are no signs in the data of home prices tanking. We stay vigilant watching for either of these trends to materialize.
And the evidence shows that the trends can change quickly. That’s why at Altos Research we track every home for sale in the country every week. Let’s look at the signals for the week of September 11, 2023.
Inventory up slightly
There are now just over 509,000 single-family homes active unsold on the market. That’s up just a hair from last week and 7% fewer than last year at this time. Last year inventory was about to start climbing again with that autumn spike in mortgage rates. Inventory grew in 2022 for the seven weeks from mid-September through the end of October. I don’t anticipate that happening again this year. Last year’s late summer inventory growth was a reaction to a big change in mortgage rates. This year, while mortgage rates are high, they aren’t climbing now. Over the next few weeks, inventory levels will fluctuate a bit down a little, up a little in a given week then start declining reliably for the fall.
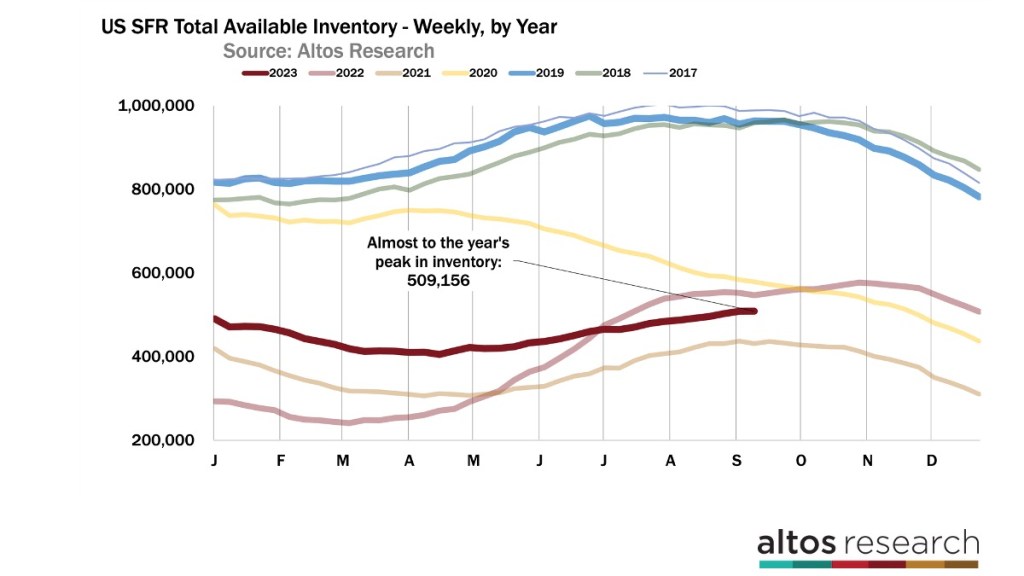
In this chart above, each line is a year. You can see last year the light red line did that unusual jump in mid-September with that 150 basis point spike in mortgage rates. Before that change, it looked as though inventory had peaked for the year. The lesson is that consumers are most sensitive to changes in rates. This market is fragile, even though it’s not deteriorating, it could. For example if mortgage rates hit 8%, we’ll definitely see it in the data.
Mortgage rates slow purchase demand
As inventory reaches peak supply for the year, we can see how this year’s high mortgage rates have slowed purchase demand. There are 348,000 single-family homes in contract right now, with only 54,000 new contracts pending in the last week. That’s down from 64,000 in the week prior. It was a holiday week, so it’s always slower, but this year was 14% fewer new sales than Labor Day week last year. In September 2021, when the pandemic frenzy was still underway, there were 80,000 to 90,000 new contracts each week for single-family homes. And we’re at 54,000 now.
There’s no getting around it. Supply is limited, demand is limited. There’s just no sign of sales volume increasing. I keep hoping for it, but it isn’t here yet.
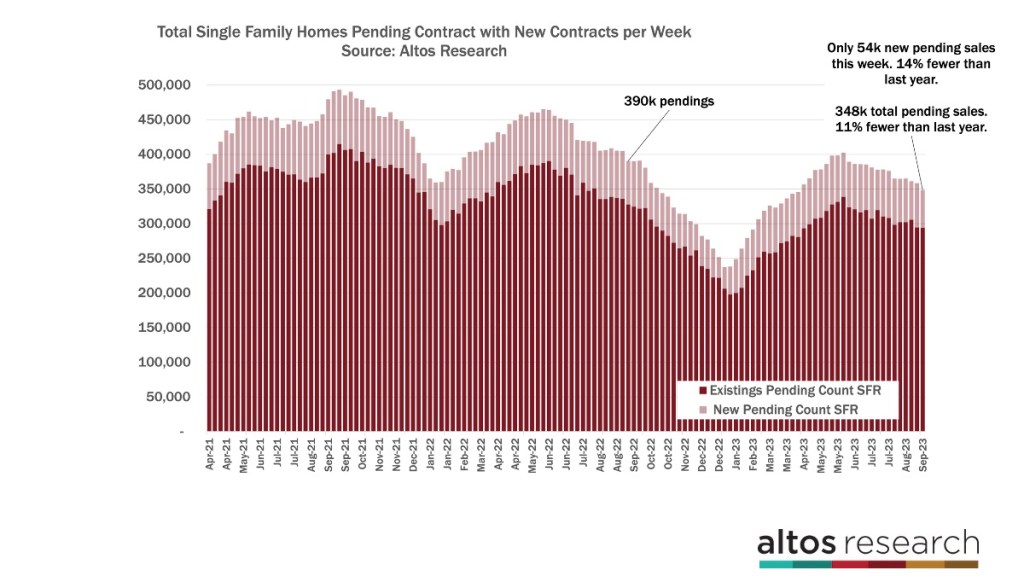
In the chart above, each bar is the total number of single-family homes in contract for a given week. The light portion of the bar are the new contracts that week. At the far right end of the chart, the bars are getting shorter and the light portion is getting shorter. Maybe in October we’ll have year-over-year growth in the new contracts, because last year in the fourth quarter, it was frozen solid. You can see in the middle of this chart how quickly the bars got shorter each week in Q4 last year. Hopefully, this year has a slightly stronger pattern. I keep hoping. If rates tick down, we’ll see an uptick in the offers being made.
Price reductions dip
Price reductions dipped this week to 36.1% of homes on the market from 36.2% last week. That surprised me because price reductions don’t usually peak until October. I suspect what we’re seeing is an increase in withdrawn listings. These are homes that had been on the market, not had offers, had taken a price reduction, still no offers, so now they’re done trying to sell for the year. Where we had 54,000 new contracts, we could see another 20,000 or so be withdrawn from listing.
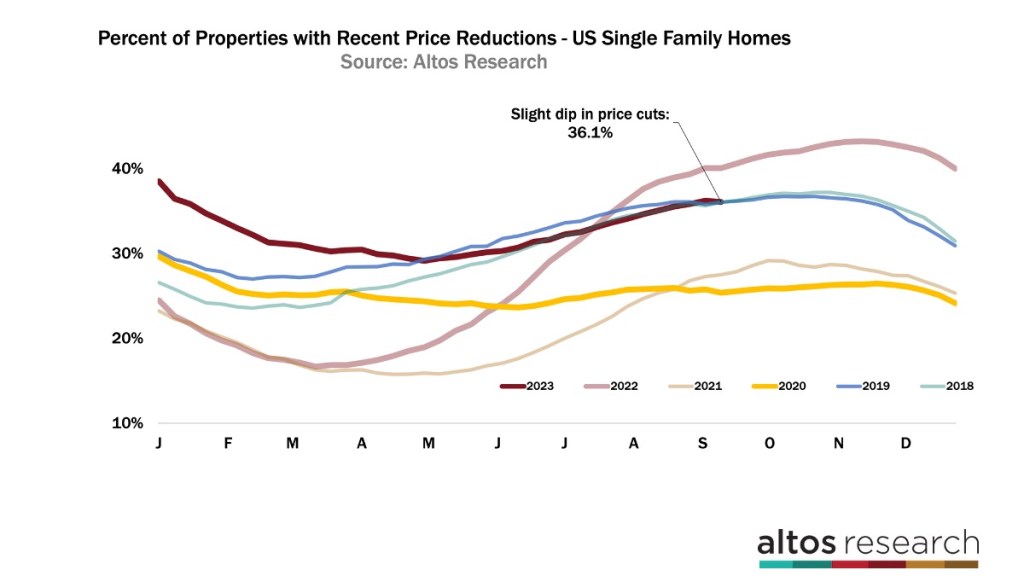
In this chart each line is a year, with the most homes taking price cuts late in the year, when sellers are trying to get a deal done before the holidays. I expect more price cuts before the month ends. It’s mildly encouraging that price cuts didn’t accelerate this week.
The takeaway here is that, in a market that is deteriorating, price reductions will be climbing. And that’s not happening right now. Last year,this happened twice, first starting in March after rates started climbing, price cuts started climbing very notably. It happened again in September after the last spike from under 6% to 7.5% on the 30-year mortgage. That 150 basis point change in mortgage rates surprised everyone. Offers stopped and sellers cut their prices. You can see the extra jump in September of the light red curve here. It wasn’t until November when the withdrawals started accelerating last year and price cuts as a proportion of the active listings started to reset for the new year.
The takeaway here is that as price reductions are flat right now, over 36% of the homes on the market shows us a slow market, but not a deteriorating market. Like every week for the past couple years, we’re all on the lookout for signals that the market might tank. Can consumers handle mortgages over 7%? Price reductions have been accelerating over the last few weeks when mortgage rates inched up to the multi-decade highs. Rates have inched lower since then and we can see that the slow housing market isn’t deteriorating further. It’s not a repeat of last year. Unless mortgage rates spike to like 8%. Then, we will see that price cuts pattern again.
I’ve been pointing out lately that it is more the change in mortgage rates rather than the absolute levels that consumers are responding to. We can see that in the pattern of home list price reductions across the country.
Median home price is down
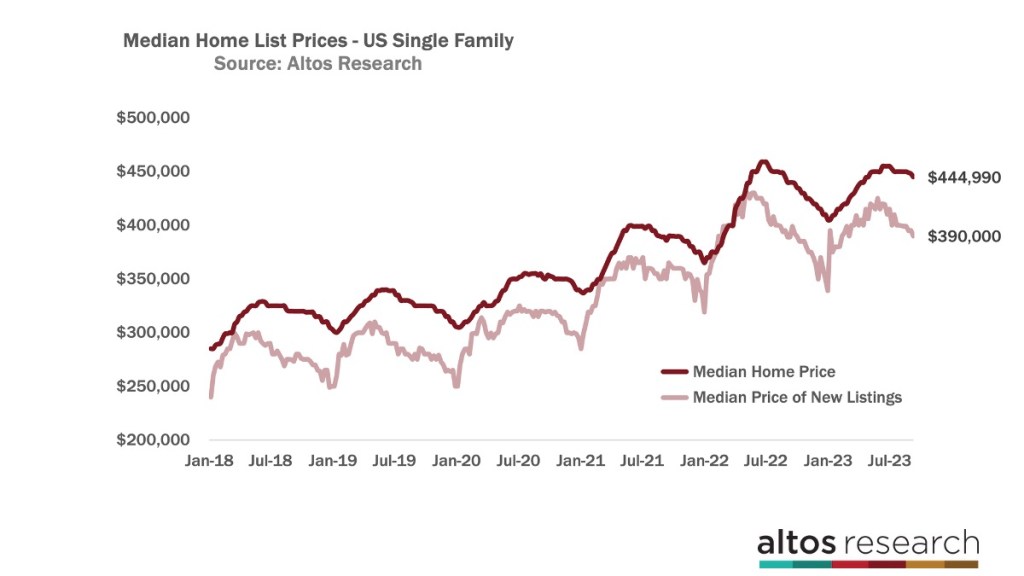
The median home price in the US is now $444,990. That’s down about 0.7% from last week. And still up about 1% from last year at this time. The median price of the newly listed cohort is $390,000 now, that’s down from last week and essentially unchanged vs last year. In this chart the dark red line is the market’s price, the light red line is the price of the new listings each week. Prices trend down in the second half of the year and these changes look like totally normal seasonal action.
I mentioned that The Wall Street Journal editorial that is so misinformed. The writer was trying to use New Home Sales prices from April to paint a dire picture of the whole U.S. housing market now.
Here’s what we know about home prices now around the U.S. We’re in a supply-constrained market, and there have been sufficient buyers to support prices all year long. When mortgage rates moved from 7% to 7.5% this summer we can see the damper on buyers. That capped any year-over-year price gains. Affordability matters and consumers adjust quickly. Home prices will end 2023 roughly flat from 2022.
Since inventory isn’t falling and is down just a little from last year, that’s an indication that home prices for 2024 will be roughly flat compared to now. Some firms have been forecasting 5% or more home price gains in 2024. There is nothing in the current data that shows me that much home price strength in the next year. That forecast would be dependent on mortgage rates falling substantially before Q2 2024. At Altos, we don’t forecast mortgage rates, so your guess is as good as mine. But there is nothing in the home price data now that shows me significant gains in 2024. That’s why we expect another year of flat home price changes.
And when we look specifically at the price of the homes heading into contract each week, we see the median price at $379,900. That’s also 1% above last year.
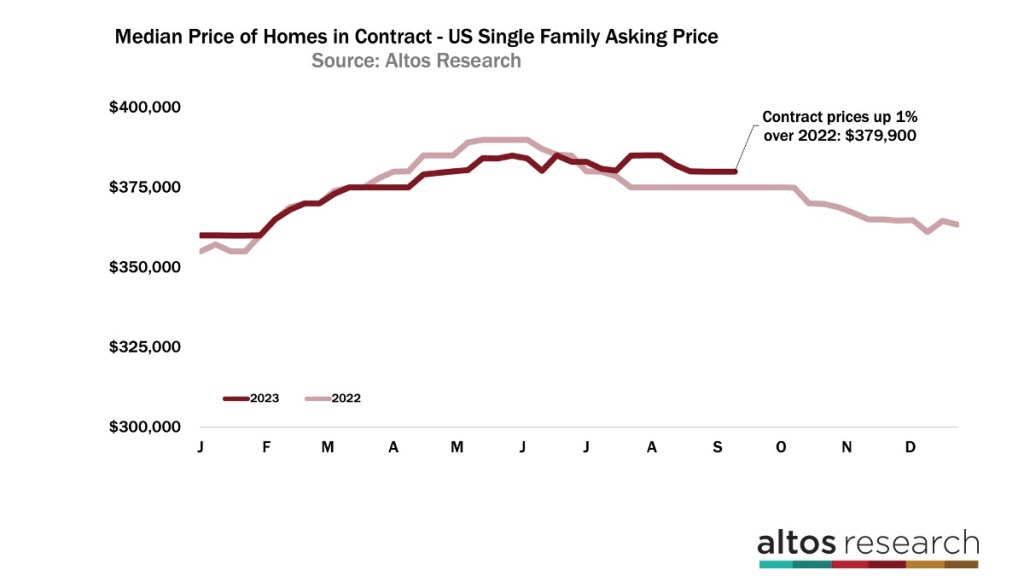
This chart shows contract prices last year versus this year. Early in the year, prices were coming in below 2022, now they’re just a fraction above. Last October, home sales prices took a notable dive with that spike in mortgage rates. We’ll see a seasonal price decline in the next few months but the annual comparison only gets easier from here.
We can see that transaction volume does not show any signs of strength. But because this is such a supply constrained market the limited number of buyers have kept a floor on prices all year. That pattern is still intact.
Mike Simonsen is president of Altos Research.