Home Showings Increase Across U.S. for Third Consecutive Month
An uptick in October Buyer Traffic Occurred in All Four Regions, Marking the First Time a Three-Month, Year-Over-Year Increase has Been Recorded Since November 2017 – January 2018
Key Points:
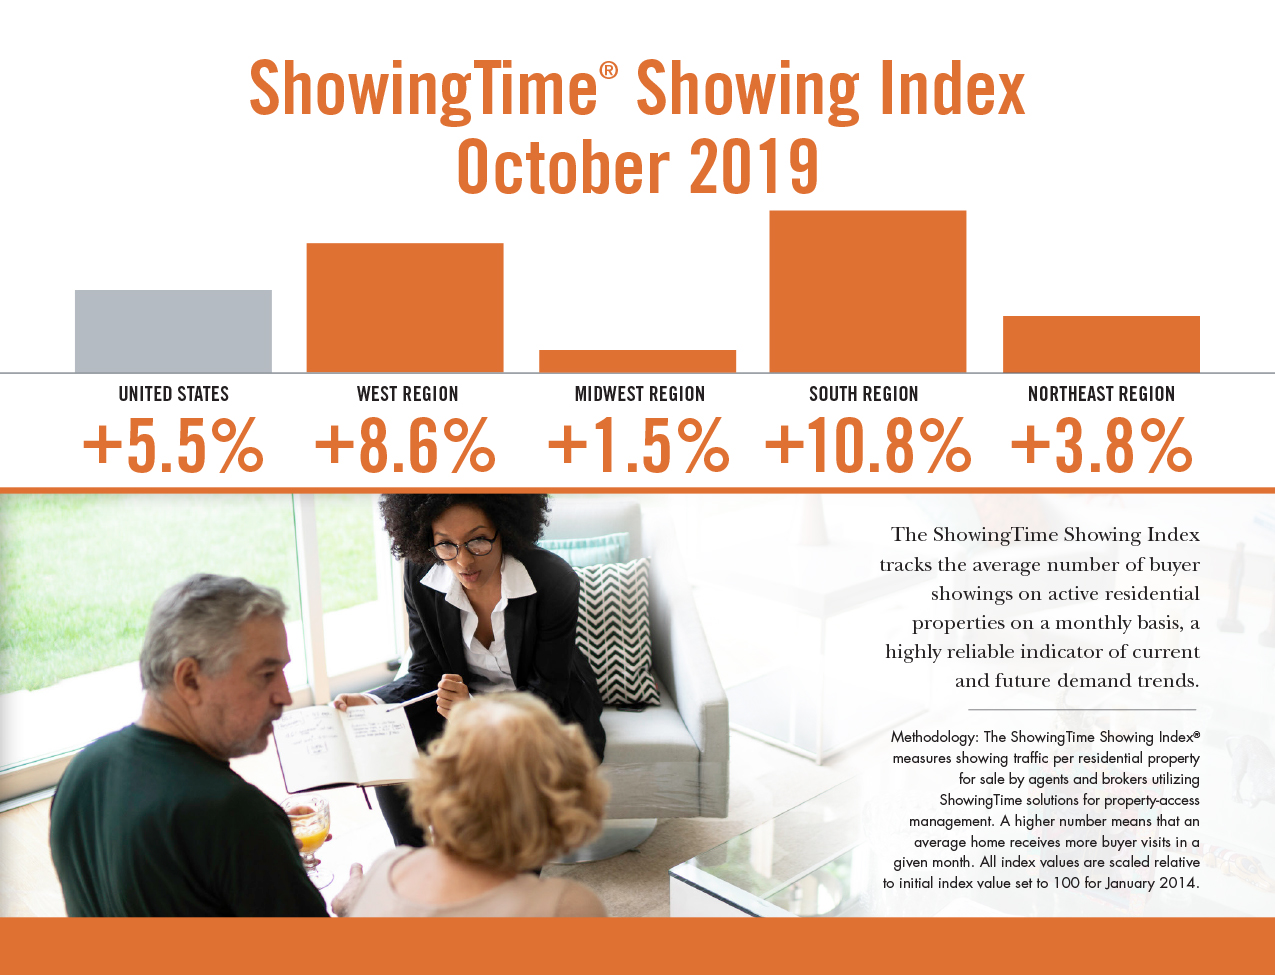
- U.S. showing traffic rose by 5.5 percent year over year, the largest national increase since March 2018
- The South Region recorded the largest October increase with a 10.8 percent year-over-year gain, its biggest since January 2017
- For the third consecutive month, home buyer traffic in all four U.S. regions increased vs. 2018
October home showing traffic was more active once again compared to 2018, as the nation saw its third straight month of higher year-over-year showing activity, according to the latest ShowingTime Showing Index report.
The 5.5 percent increase in showings nationwide was the largest jump in activity during the now three-month streak of year-over-year increases vs. 2018. The South Region led the way, with a 10.8 percent uptick in showing traffic – its biggest year-over-year increase in almost three years. The West’s 8.6 percent increase was close behind, followed by the Northeast, which saw its sixth consecutive month of year-over-year growth with a 3.8 percent increase in October.
The Midwest rounded out the regions with a 1.5 percent year-over-year gain.
“We are seeing expected seasonal slowdowns in October, although this fall continues to be more active than last year in terms of showing traffic,” said ShowingTime Chief Analytics Officer Daniil Cherkasskiy. “The increase in showing activity in both the South and West regions is noteworthy given that both had previously reported nearly year-long drops in traffic prior to August.”
The ShowingTime Showing Index, the first of its kind in the residential real estate industry, is compiled using data from property showings scheduled across the country on listings using ShowingTime products and services, providing a benchmark to track buyer demand. ShowingTime facilitates more than four million showings each month.
Released monthly, the Showing Index tracks the average number of appointments received on active listings during the month. Local MLS indices are also available for select markets and are distributed to MLS and association leadership.
To view the full report, visit https://www.showingtime.com/showingtime-showing-index/.
About ShowingTime
ShowingTime is the residential real estate industry’s leading showing management and market stats technology provider, with more than 1.2 million active listings subscribed to its services. Its showing products and services simplify the appointment scheduling process for real estate professionals, buyers and sellers, resulting in more showings, more feedback and more efficient sales. Its MarketStats division provides interactive tools and easy-to-read market reports for MLSs, associations, brokers and other real estate companies, as well as a recruiting tool for brokers. ShowingTime products are used in more than 250 MLSs representing nearly one million real estate professionals across the U.S. and Canada. In September, ShowingTime acquired Centralized Showing Service, Inc. (CSS) to better serve the needs of clients in the residential real estate industry. The two established companies bring together a combined 43 years of experience helping real estate professionals and their clients. For more information, contact us at research@showingtime.com.
{{cta(‘a95db50c-87e5-4dde-91cb-3e915197d339’)}}