A shift from a majority of traditional firms to other operating models has changed the game for business valuations.
With nearly 4,000 valuations of residential real estate firms under our belts, we’ve practically seen it all. Brokerages of all shapes and sizes have honored us with their business, seeking valuations for a myriad of reasons.
Decades ago, the majority of brokerages we did work for operated under a more traditional commission model, which, in simple terms, offers agents uncapped graduated commission plans. While this model has worked for decades and still works for many firms today, it’s no longer the dominant model.
Benchmarking the financial performance of our valuation customers used to be pretty cut and dry. Because most were traditional firms, they scored large margins on the top line as traditional firms tend to keep a substantial portion of every commission dollar earned. Though they typically spent a lot on support staff, office space, and marketing for their agents, a good chunk of change still fell to the bottom line. With most brokerages operating similar models, the various financial and operational metrics, we looked at had a low standard deviation.
With the massive growth of brokerages operating with alternate commission models, benchmarking has become more of a challenge. Now more common are firms that employ varying forms of flat-fee, 100%, and capped models. While these alternate models exhibit wildly different top-line margins and operating expense ratios on their way to the bottom line, interestingly, the delta on the bottom line isn’t necessarily all that different.
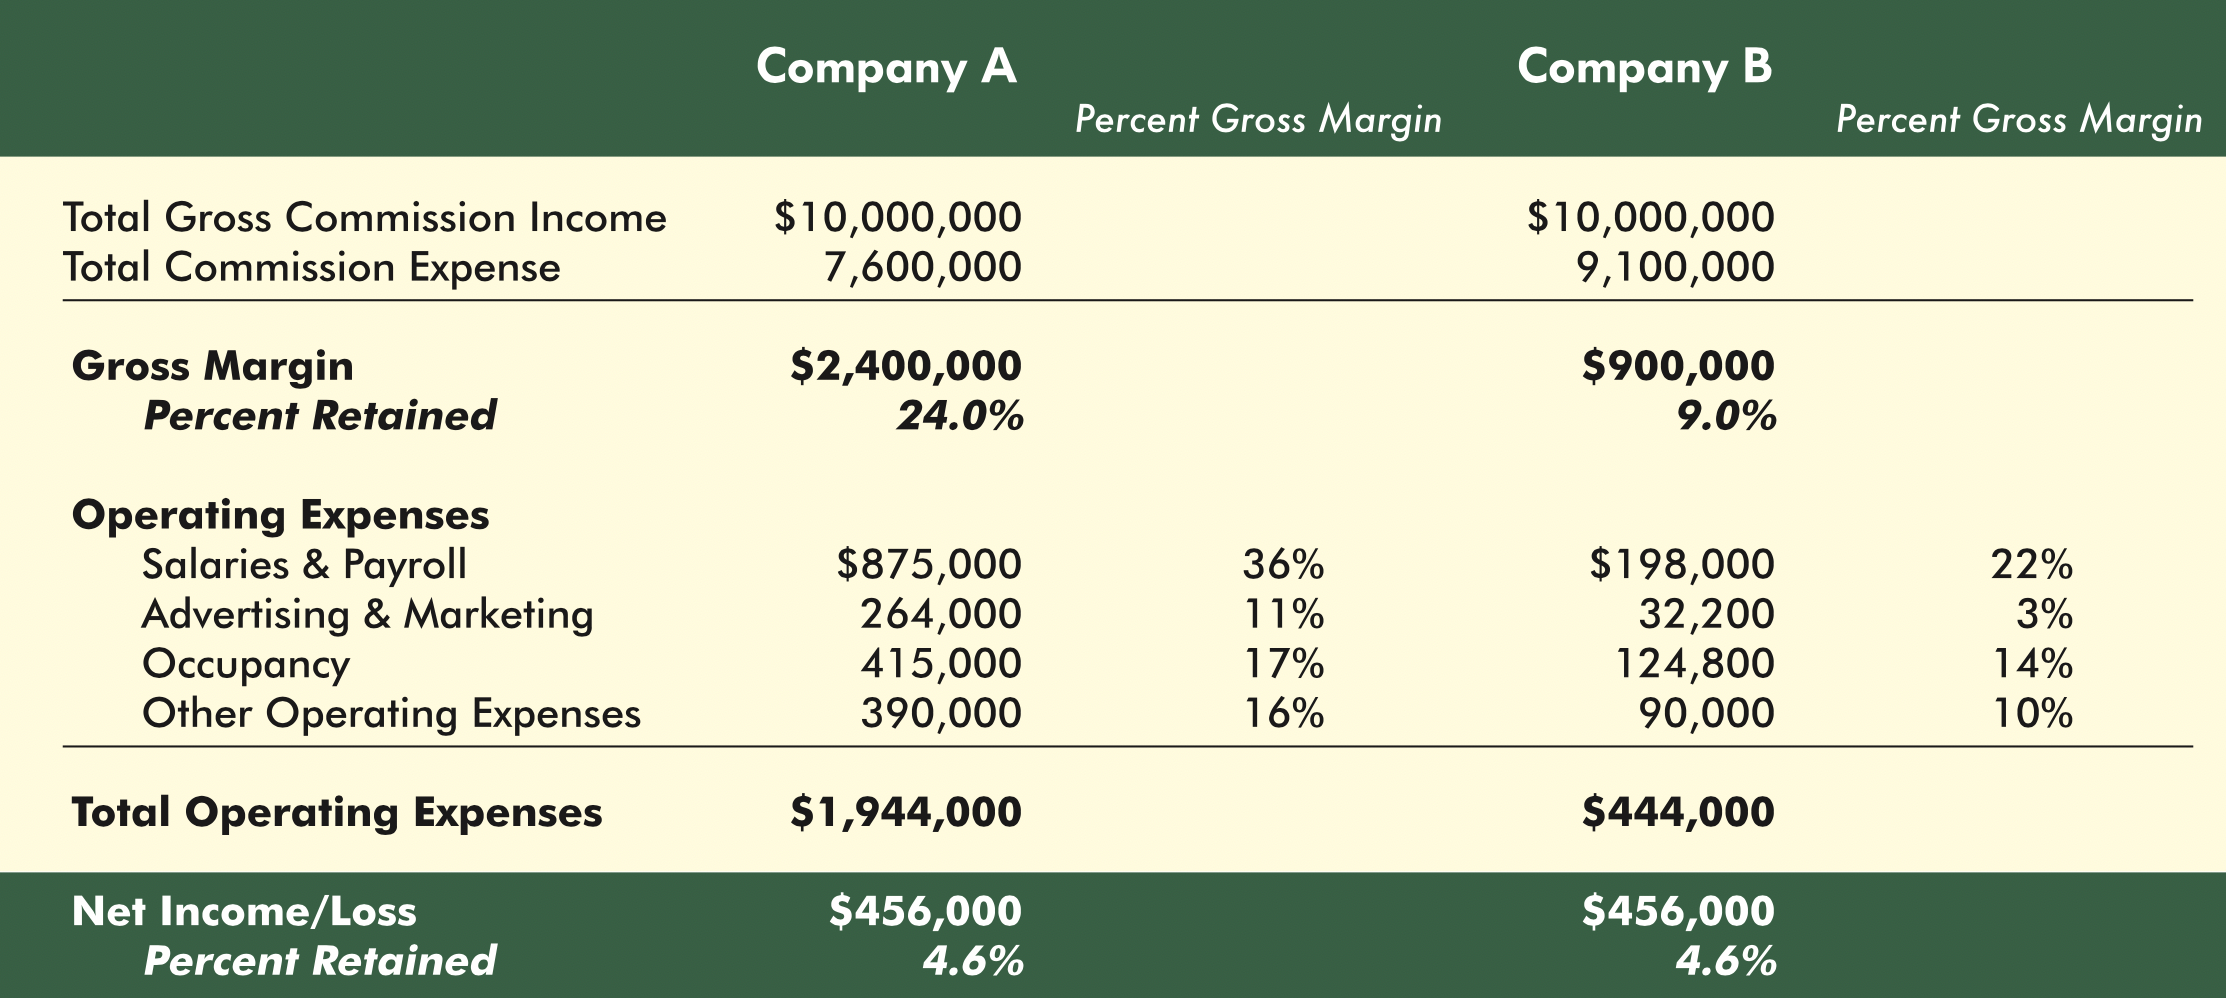
To illustrate the different paths to the bottom line, consider the numbers for Company A versus Company B. Company A generated $10 million in revenue over the last 12 months while retaining $2.4 million. It spent 36% of gross margin on Salaries/Payroll, 17% on Occupancy, 11% on Advertising/Marketing, and 16% combined for all other operating expenses. Company A’s Net Income was $456,000, giving it a Return on Revenue of 4.6%.
Company B also generated $10 million in revenue, yet it only retained $900,000. Despite its radically lower gross margin, Company B still ended up with $456,000 in Net Income and a Return on Revenue of 4.6%. How did it end up with the same bottom line as Company A? It only spent 22% of gross margin on Salaries/Payroll, 14% on Occupancy, 3% on Advertising/Marketing, and 10% combined for all other operating expenses.

In this example, Company A would be your standard, traditional uncapped graduated commission plan brokerage. At the same time, Company B operates more of a fee-based model (these firms typically pay 100% commission to agents while charging monthly fees or transaction fees…the $900,000 gross margin for this company is a total of all fees collected.) Company B didn’t retain as much as Company A. Still, since Company B didn’t offer as much support from personnel, marketing, and office-space perspective, its collective operating expenses were vastly lower, thus allowing it to achieve the same return.
This illustration drives home the difference in models while demonstrating our benchmark challenges. It also shows that there are many different paths to achieving profitability. From a valuation perspective, these companies may or may not be worth the same. Any variance in value would be less of a factor relating to the model and more the dozens of other factors we look at when applying multiples. At REAL Trends, we are model agnostic, so if your firm needs a valuation, give us a call today!
