By now, the data showing falling inventory every week isn’t a surprise. Even though it’s March — a time when normally we would expect inventory to increase each week as the peak home buying season is almost upon us — sellers are holding back. There is no sign of a surge of sellers, no panicky investors selling, almost no one out of work in the U.S. and so there are no distressed sellers either. Most homeowners have locked in low mortgage rates, so no one is looking to unload that either. Even if it’s time for them to move, most people are still not selling their homes.
As a result, the steep slowdown of the housing market from 2022 has largely passed us. Now, we have good visibility on many of the trends for the remainder of 2023. These trends could change if we have a dramatic recession, start to get big job losses or if mortgage rates spike over 7% on strong economic data. There are risks to a renewed downturn in housing, but the data as of right now is very stable. It’s going to be hard for the most bearish housing market predictions to take shape this year.
Inventory
Available inventory of single-family homes for sale in the U.S. dropped by another 1.5% this week to only 412,000. In 2022 at this time, there were 248,000 houses on the market, but that number was beginning to climb. In 2022 by mid-March, inventory was steeply increasing compared to the crazy record lows of the COVID-19 pandemic. Inventory was so low in 2022 because Americans had been buying everything in sight, taking advantage of the last few weeks of ultra-low mortgage rates. After February, demand slowed way down and inventory finally started to build.
This year’s inventory decline isn’t about buyer demand, it’s about sellers. As I mentioned, there are no reasons for anyone to be selling their house right now. So while the data shows there are 66% more homes on the market now than in 2022, that margin is shrinking. Each week there are fewer homes on the market; meanwhile, in 2022 each week there were more homes on the market.
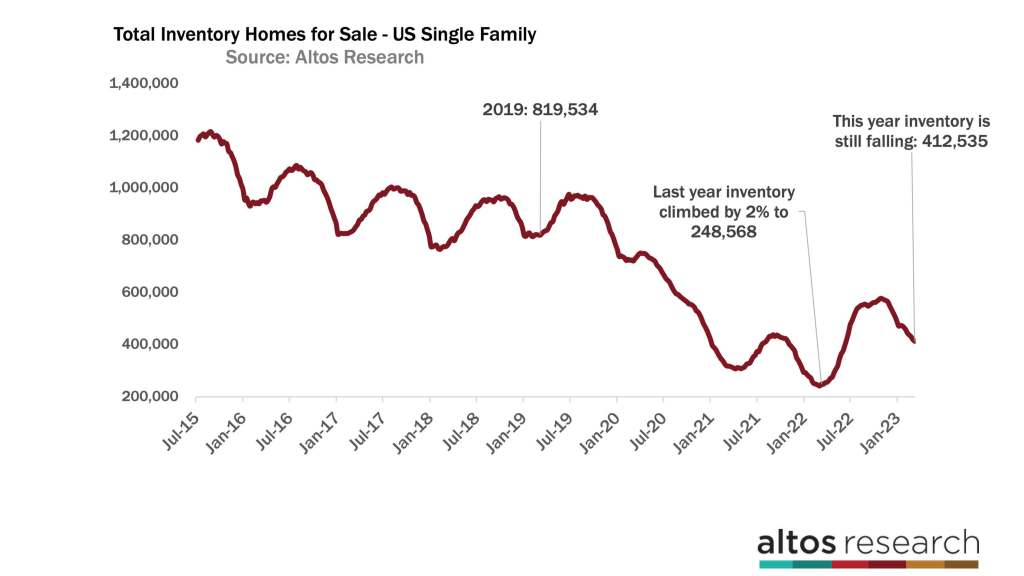
In 2019, there were 812,000 homes on the market. There are half that many now. I’ve highlighted that point on the chart above. You can see at the right end of the chart, that inventory is still dropping quickly each week. It looks likely that we will have a few more weeks of declines. Inventory may go down 1% or .5% before turning flat and finally increasing in April.
We’ll discuss this more in the webinar on Wednesday, March 15, 2023. We’re now looking at scenarios where at the end of 2023, there are only 500,000 homes on the market. One way to project future price changes is to look at year-over-year inventory changes. This change would imply that while home prices remain flat to down for 2023 compared to 2022, next year prices would climb. That scenario would be based on supply staying on the restricted path it’s currently on. In other words, if 2023 inventory doesn’t start rising soon, supply remains restricted and a floor forms for prices in the future.
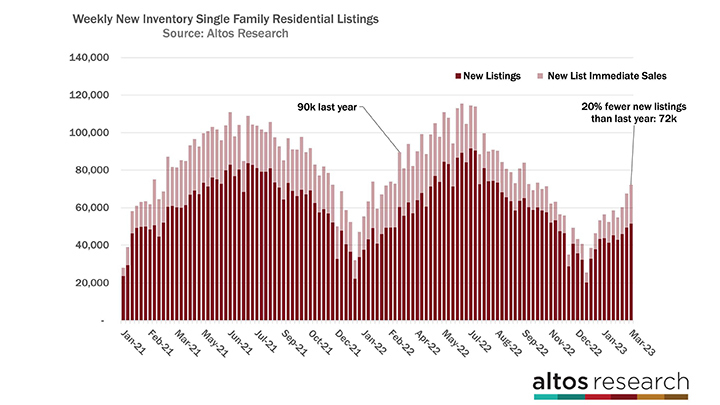
Each week there have been 20% fewer new listings than in 2022 at this time. The total number of home sales this year will remain low because we have such a supply-constrained market.
Interestingly, the data shows that the percentage of new listings that went into contract immediately has climbed to 29%. Immediate sales are those new listings that hit the market and take offers essentially immediately after listing and go into contract within a couple of days. They bypass the active market and go straight to pending. From 2020 to 2022, these immediate sales were the defining characteristic of the market.
That’s the light red portion of each bar in the chart below. Late in 2022 those immediate sales didn’t happen and inventory built up. Now with inventory so tight, some buyers are chasing those few, great opportunities and so immediate sales are climbing again this spring. You can see the total number of new listings is dramatically fewer now than in 2022 at this time, but it is climbing a bit for the spring finally.
The housing bubble predictors on the internet hate it when I point this out, but there is no sign of any big surge of inventory anywhere in the country. This implies that even at higher mortgage rates, home prices are not declining dramatically from here. The supply side of the supply/demand ratio just seems too small.
Price
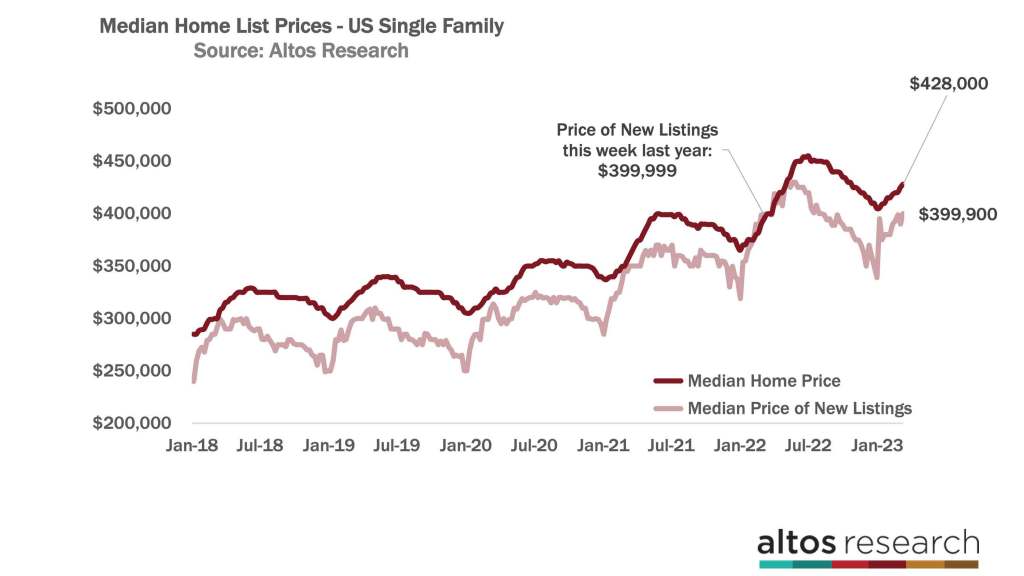
Prices — when compared to each previous week — are inching up. The median home price in the U.S. is $428,000 this week. Compared to 2022, home prices are flat to down. In 2022, home prices were still climbing very quickly each week with the last gasps of demand for cheap mortgages. This year, prices are rising because it’s spring but they aren’t rising as steeply, so the year-over-year comparisons are getting lower.
These are all signals we’ve been talking about for a long time. Like inventory, there are no signs anywhere in the data that home prices are declining or that sellers are panicking or that buyers are on strike. 2022 was nuts, so the year-over-year comparisons are down. Home prices as measured by the ‘price new listings’ are down from 2022. The median price of the new listings this week can be seen in the light-colored line in the chart below. It is $399,900, which is just a fraction lower across the country than in 2022. That’s a notable signal that home prices are down.
Buyers are price sensitive. That’s probably the big difference between 6.5% mortgage rates and 3% rates. At 3% I can overbid and my payments don’t change much. At 6 or 7% I’m very sensitive to each additional dollar of cost. There is low supply and moderate demand this year, but home prices don’t have an upside risk. They’re not jumping from here. Demand is at the price points we’re already at. We already know what the headlines will say for the rest of the year.
Pending sales
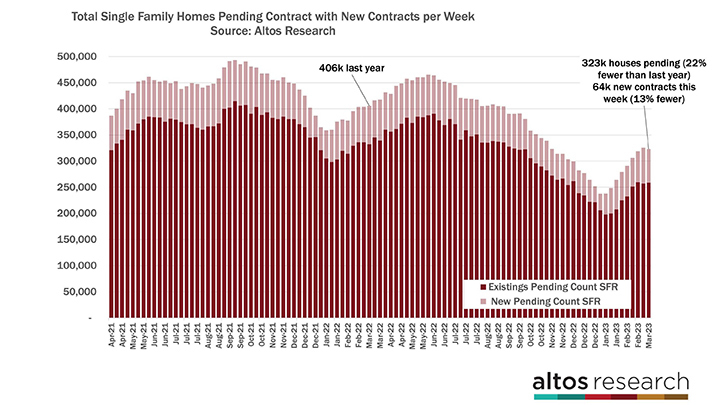
The number of homes with pending contracts was basically flat week over week. There are 323,000 single-family homes in the pending stage now. That’s 22% fewer than in 2022. That’s a lot fewer sales to be completed in the coming months, but it’s an improvement over the fall.
With 64,000 new contracts this week, as seen in the light red portion of the bar below, there were slightly fewer this week than last. There’s always a little week-to-week volatility so one week does not represent a trend. I’m looking for a gradual increase in pending sales over the next 14-15 weeks. 2023 will have significantly fewer sales than the past few years, but seeing single-family home contracts climbing to 80,000 or so each week would be much healthier than the second half of 2022.
If economic conditions, recession, job losses, inflation, bank runs and that kind of uncertainty doesn’t slow down, then home buyers will slow. This pending sales chart will struggle to grow to its July 1 peak. The light portion of the bar represents the new pending sales, and it was shrinking rapidly each week while inventory was climbing. So keep your eyes open for that.
If we have that kind of market slowdown later in 2023, then we’ll also see a steeper climb in the price reduction data. Because there are so few homes on the market, the good ones are going quickly. The percentage of homes on the market that have taken a price cut is down again this week to just over 30%. That’s frankly a lot fewer than I’d expected we’d have now.
You can see this year’s curve is now just above recent years. Just slightly more of the market is sitting with price reductions. It’s in a totally normal range. This tells us that future transactions do not have significant downward price pressure. In other words, if the house is on the market now and there are no buyers at this price, there will be a price cut. So, the transaction in the future would be at a lower price.
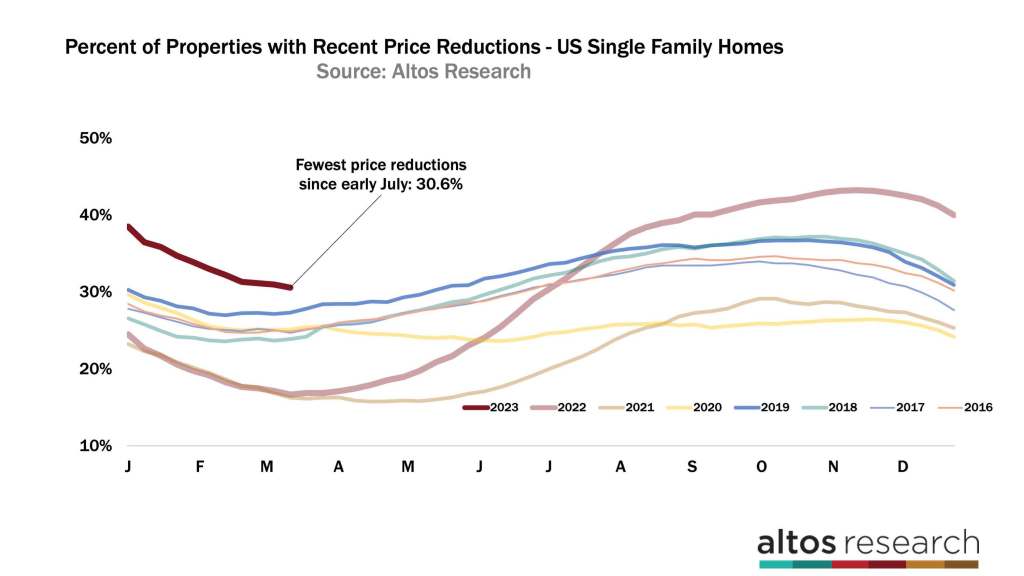
This data also tells us that when we talk about how home prices overall are flat to down from last year, the bulk of those price declines happened in July, August, September and October 2022. So the sales that are complete now are lower than what they were a year ago. But the stuff that’s on the market now at this price, doesn’t have pressure to price lower in the future. This is another signal that while the home price headlines will be negative for several months. We have visibility beyond that where they won’t keep falling. Remember, if a house is on the market now, it takes an offer in April and it closes in May or June. Those headlines start coming out in July. So that’s the visibility we have with this chart here.
More next week